I built a Bitcoin regime classifier. Very simple goal to just tell me when to be long spot and when to sit in cash. No leverage, no shorting, just "are we in a bull run or not." Here's what I got.
15 daily factors voted into a single confidence score. Ten of them lean bullish:
Mayer multiple > 1, Donchian breakouts, post-halving year flag, weekly sentiment dip-buys, sustained negative funding rates, M2 money-supply acceleration, pre-election risk-on
Five lean bearish:
USDT supply contraction, 10y Treasury yield rising, momentum breakdowns, full risk-off composite, weekly to daily trend rollovers):
Each factor is z-scored, sign-flipped to its expected direction, and weighted by its in-sample information content. Summed it up, run it through a tanh squash, and got a signed score in [−1, +1]. Yesterday's close determines today's position.
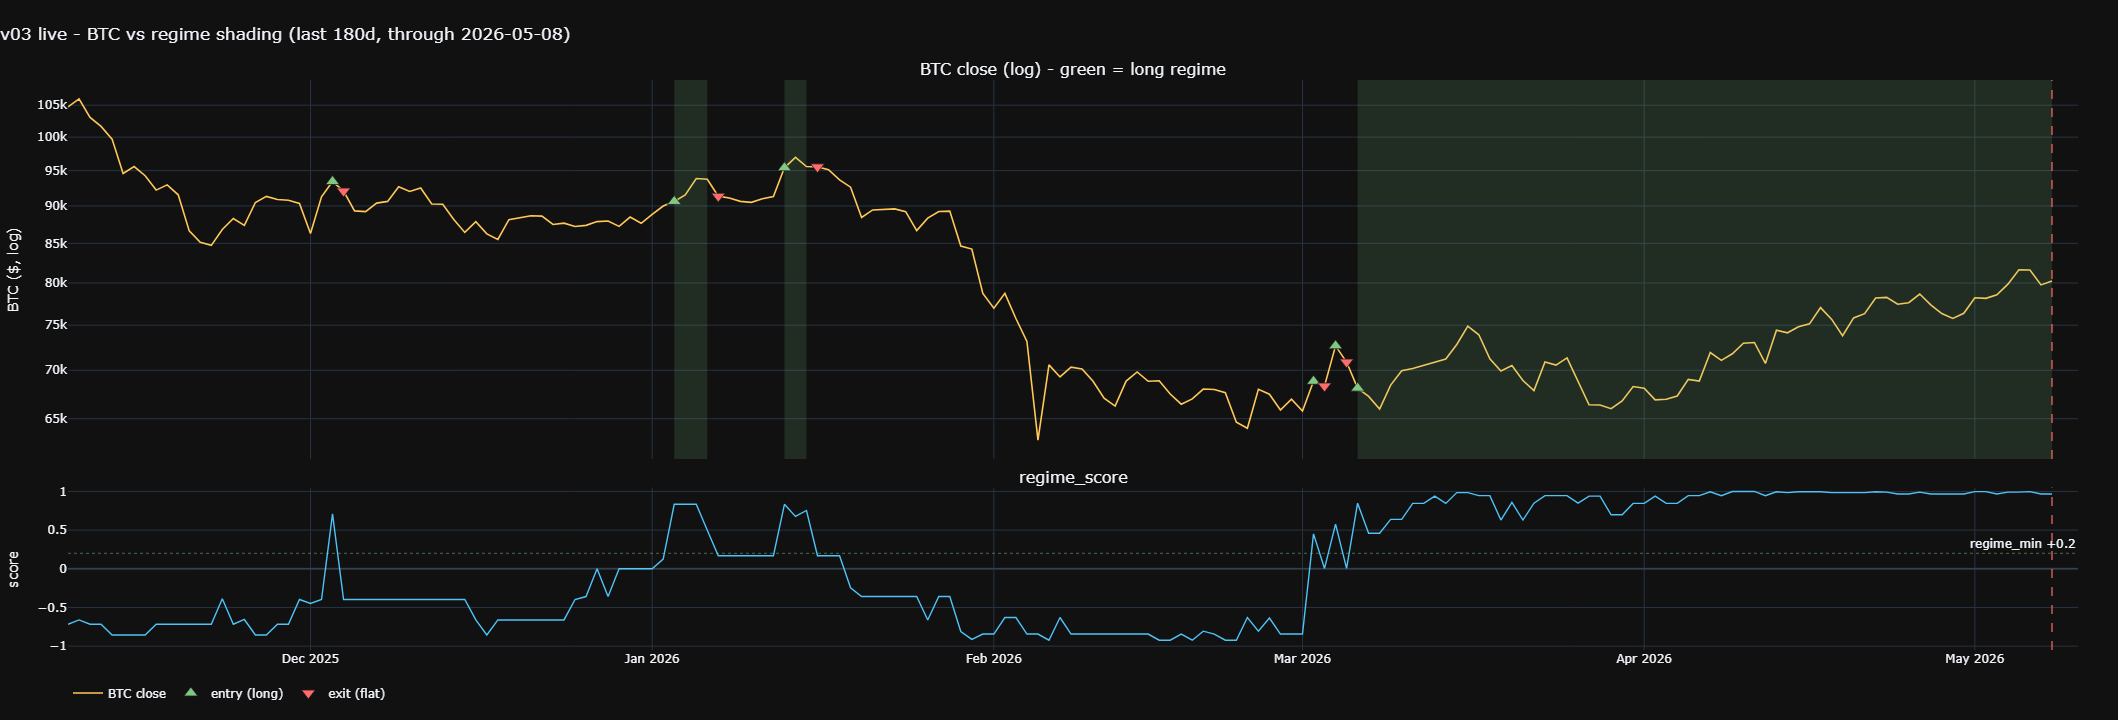
If score > +0.2: go long, sized by the score itself (so 0.5 means half-deployed, 0.9 means almost full capital allocation). If score <= +0.2 we just go flat, cash. The bear factors don't get shorted they just sharpen the "go flat" trigger, so I exit earlier and more accurately than a pure long-only screen would.
Trained on 2017 to end of 2023. Left 2024 - 2026 for OOS. Pre-registered the screening gates (Newey-West t-stat ≥ 2.5, cluster-collapse at |corr| >= 0.70, >= 3 distinct factor families) before looking at any number.
IS Sharpe was around 1.8. OOS Sharpe 1.35. PnL 1.52× HODL. Max drawdown −22.9% vs Bitcoin's ~50%. Real edge. What do people think?