Do the technical analysis features that day-trading course sellers actually work? Maybe. Here's what I've found:
"Technical Analysis" indicators and patterns like the head and shoulders and others typically actually reproducibly emerge from the market from pure randomness (I saw this in a youtube video) which gave me an idea.
The thing is it seems like these patterns emerge as a symptom or accidental result of underlying trade flow rather than constituting edge but I ran a study on this anyway. The factors I studied here are called "Orderbook Memory" factors. The idea is that you can actually draw the typical trading patterns that the gurus teach simply from supports and resistances. And these support and resistance lines are simply derived from past lows or highs, hence this concept of the orderbook having "memory"
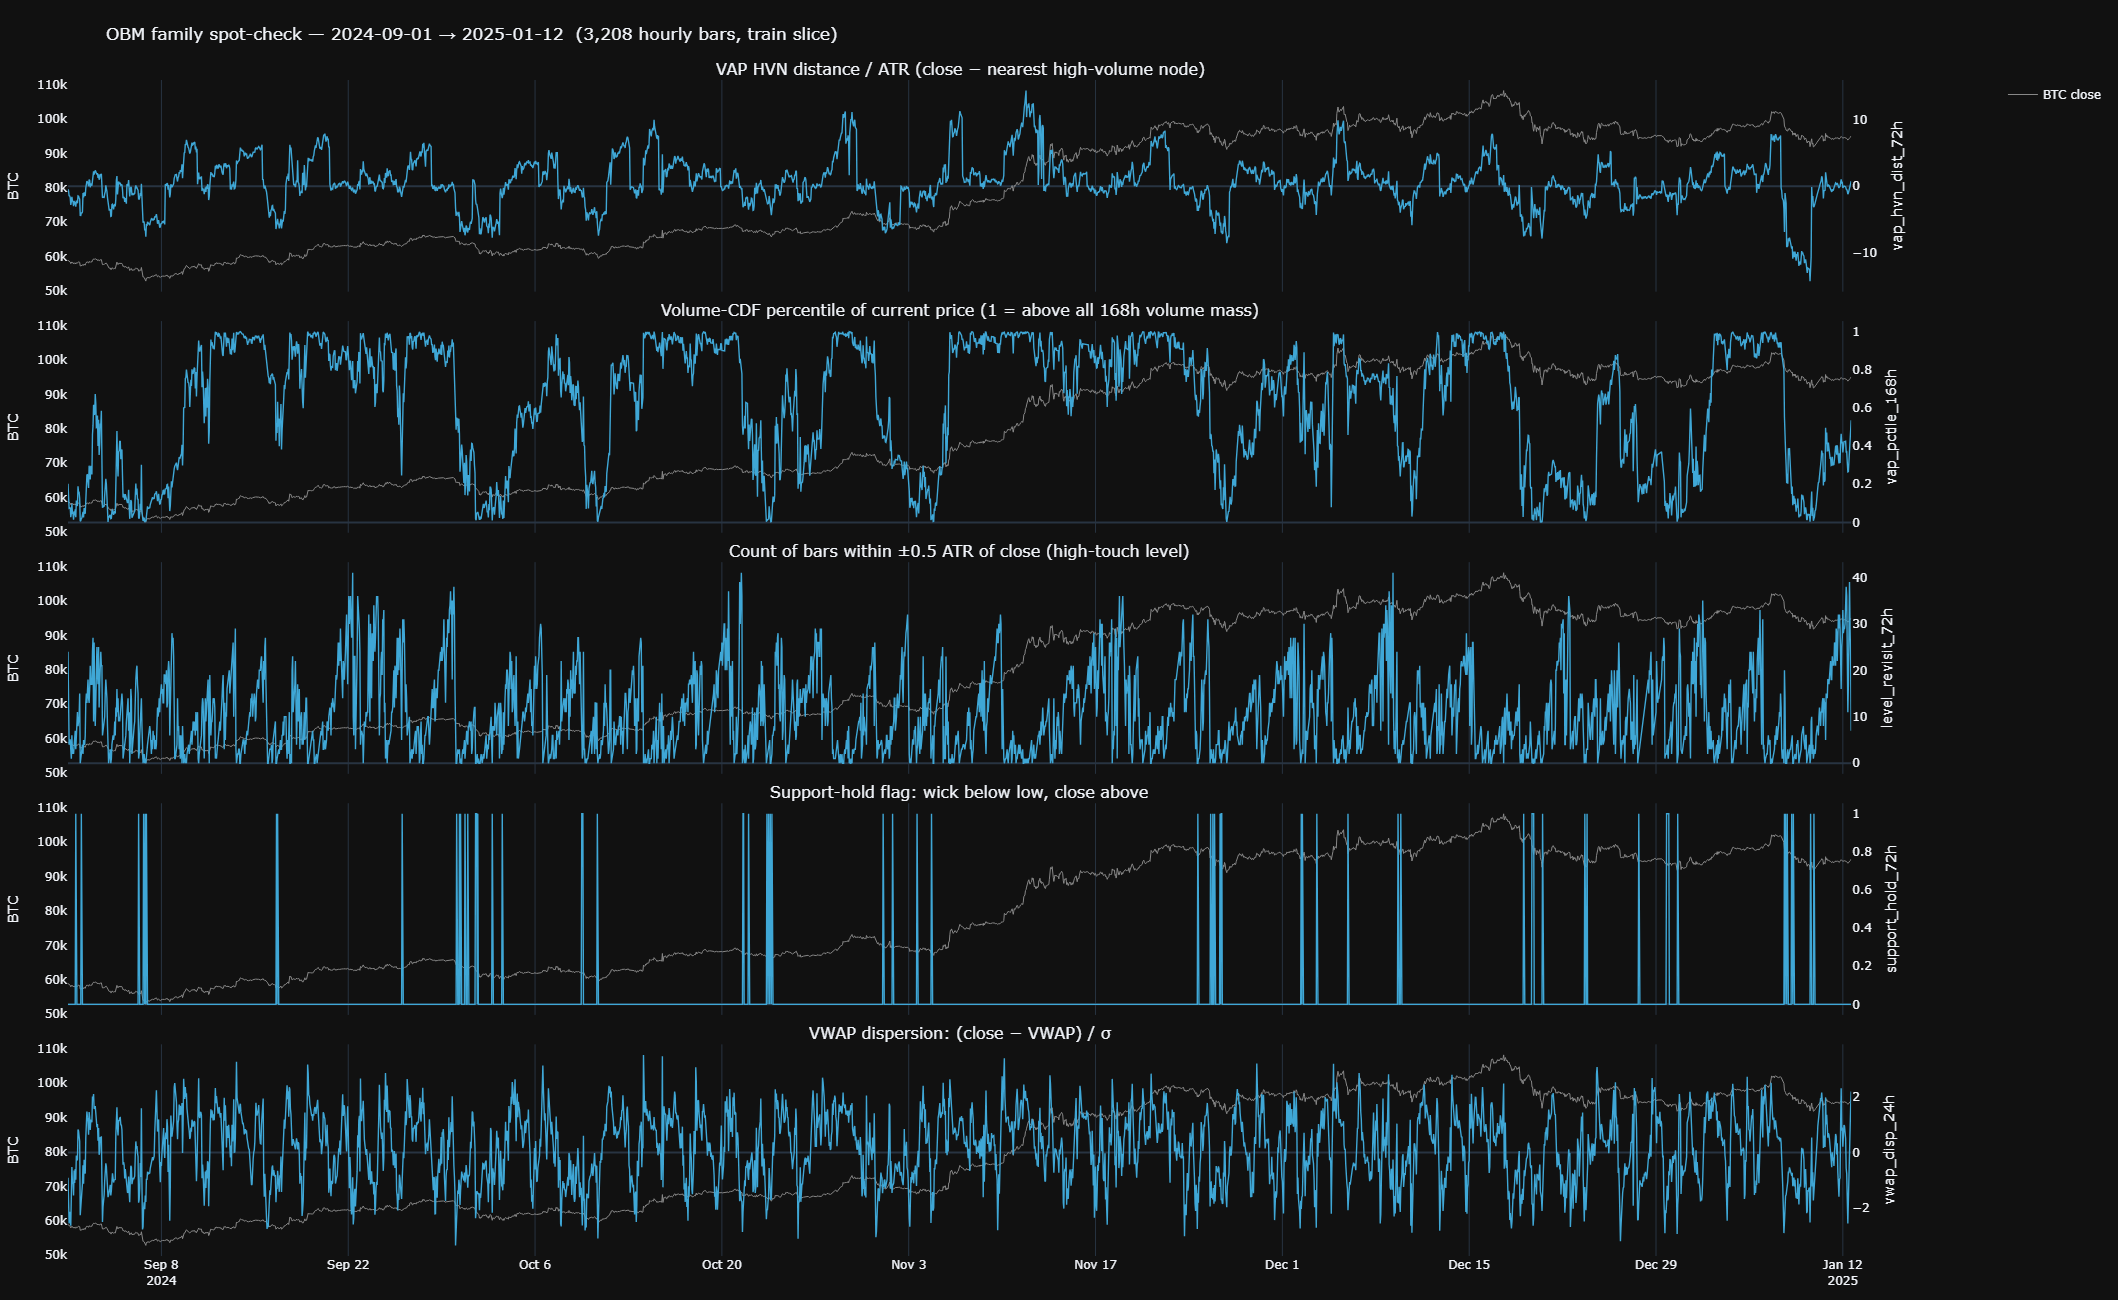
I picked and computed some of these factors in order to "spot check" whether they can visibly track any rallies or market movements. I then superimposed each individual factor with the price of BTC back to 2017 on hourly bars. Minute bars and lower timeframes are too noisy to gather anything worthwhile.
I computed the following factors:
("obm_vap_hvn_dist_72h", "VAP HVN distance / ATR (close − nearest high-volume node)"),
("obm_vap_pctile_168h", "Volume-CDF percentile of current price (1 = above all 168h volume mass)"),
("obm_level_revisit_72h", "Count of bars within ±0.5 ATR of close (high-touch level)"),
("obm_support_hold_72h", "Support-hold flag: wick below low, close above"),
("obm_vwap_disp_24h", "VWAP dispersion: (close − VWAP) / σ")
I feel like sometimes there are some resemblances but it's so noisy it's almost misleading.
Code5 lines
("obm_vap_hvn_dist_72h",   "VAP HVN distance / ATR (close − nearest high-volume node)"),
    ("obm_vap_pctile_168h",    "Volume-CDF percentile of current price (1 = above all 168h volume mass)"),
    ("obm_level_revisit_72h",  "Count of bars within ±0.5 ATR of close (high-touch level)"),
    ("obm_support_hold_72h",   "Support-hold flag: wick below low, close above"),
    ("obm_vwap_disp_24h",      "VWAP dispersion: (close − VWAP) / σ"),
I did not only compute these 5 different factors, in fact I built 29 hourly variants over ~6 years of hourly Binance BTC bars just to see: does price actually remember high-volume nodes, level revisits, round numbers (e.g $100k), and VWAP dispersion?
For each factor: Spearman rank correlation with forward returns, plus the mean of (factor × forward return) and a Newey-West t-stat with Bartlett lag 24 to handle hourly autocorrelation. Pre-registered gate before peeking: |t| ≥ 2.0, plus Benjamini-Hochberg false-discovery control at q ≤ 0.10 across all 161 candidates so I'd pay for the multiple testing. Also required sign stability across two distinct bull cycles (retail-driven 2020–21 vs ETF-driven 2024–25) so I wasn't buying one regime's noise.
Happy to post numbers but as a summary:
In-sample (train mask, 27,664 hourly bull-regime bars):
- 18/29 OBM factors passed |t| ≥ 2.0
- Top t-stats ~3.0–3.8
- But Spearman rank correlations were only ~0.01–0.03 (the tell — "significant" but tiny)
- 7/29 had empirical signs opposite to theory
Out-of-sample (forward holdout, 6,916 bars from Jan 12 2025 → May 2026):
- Bucket the holdout by signal strength → forward-return gradient went flat
- Dollar PnL ≈ 0.086 log-points worse than the daily-regime-only baseline
- Apparent Sharpe lift came from cutting position size, not predicting returns
It looks mostly like survivorship artifacts to me but I don't think I'm saying anything novel, was just curious to see if I could find something there.