Back

I use a unique method to aggregate Intel. I use a formula to predict the potency of Cascades caused by compression and oscillating between opposites. Yin yang. 2. Markers obey wave physics and lamda math. 3. The narrative structure obeys the same math. 4. Quantum mechanics and the concepts of wave function analysis and fractal analysis can also be layered on for another multiplicative confirmation layer. The goal? Find the bottom of the monthly, weekly, and daily candle wick distribution at the bottom and know approximately WHEN that happens. Cheers
May 25, 2026 · 12:32 PM · 14 views · Commons
0 Reposts
1 Likes
2 Replies
@luwyn · May 25, 2026 · 11:11 PM
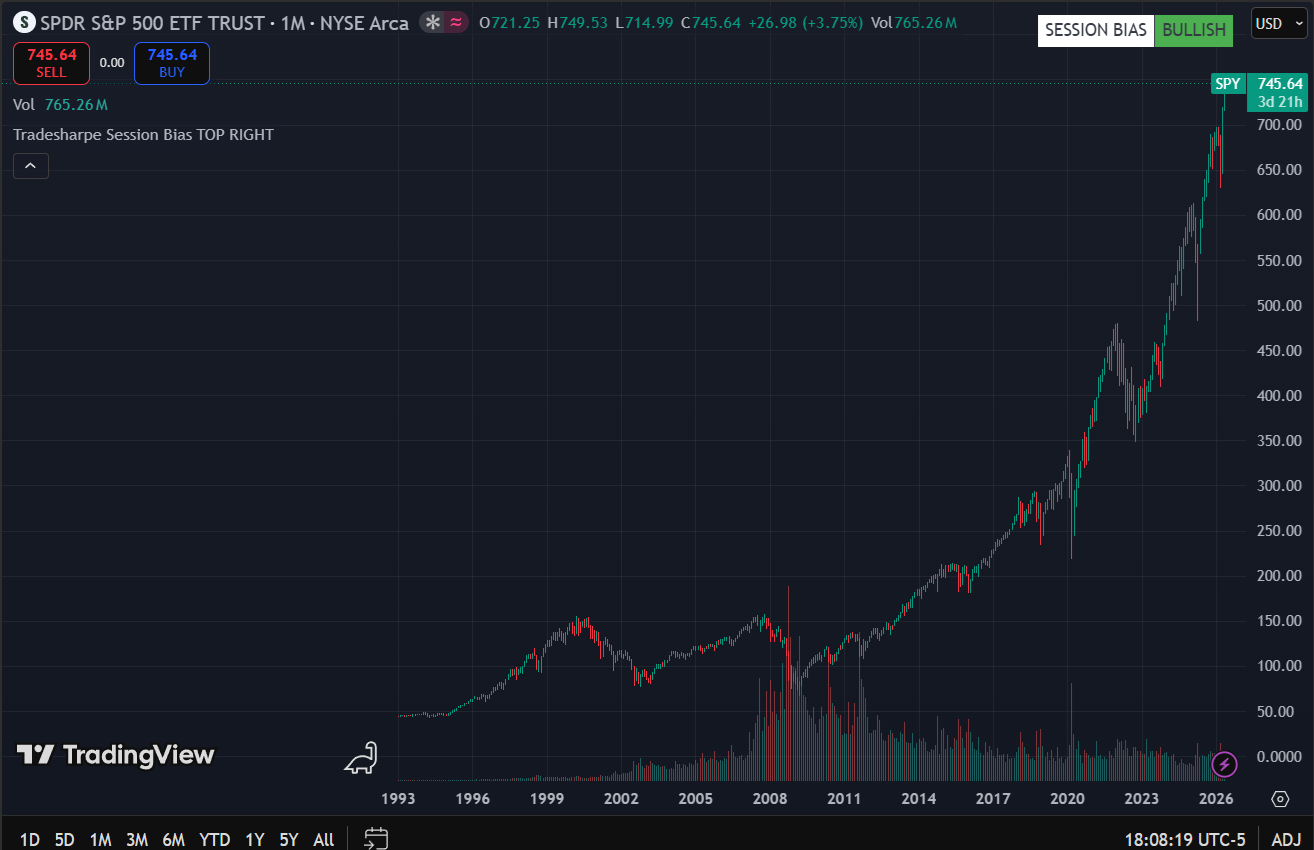
I forgot to add that the best predictor of an ATH is a recent previous ATH. Now, we can define "recent previous ATH", but my point is to ask how many daily ATHs can you find in this monthly chart? There are so many, I can't count them all.
Reply image
Reply
@luwyn · May 25, 2026 · 11:06 PM
I find it interesting that you only specify bottoms. After a few years of studying the markets, I have come to the conclusion that sometimes I can spot a bottom or close to a bottom. I am correct sometimes because I usually always have a system that selects previous support and resistance levels. Tops on the other hand, are extremely difficult for me to spot, and I am usually wrong a very high percentage of the time. I could basically choose for the price to not be a top if my system calls a top.
Reply