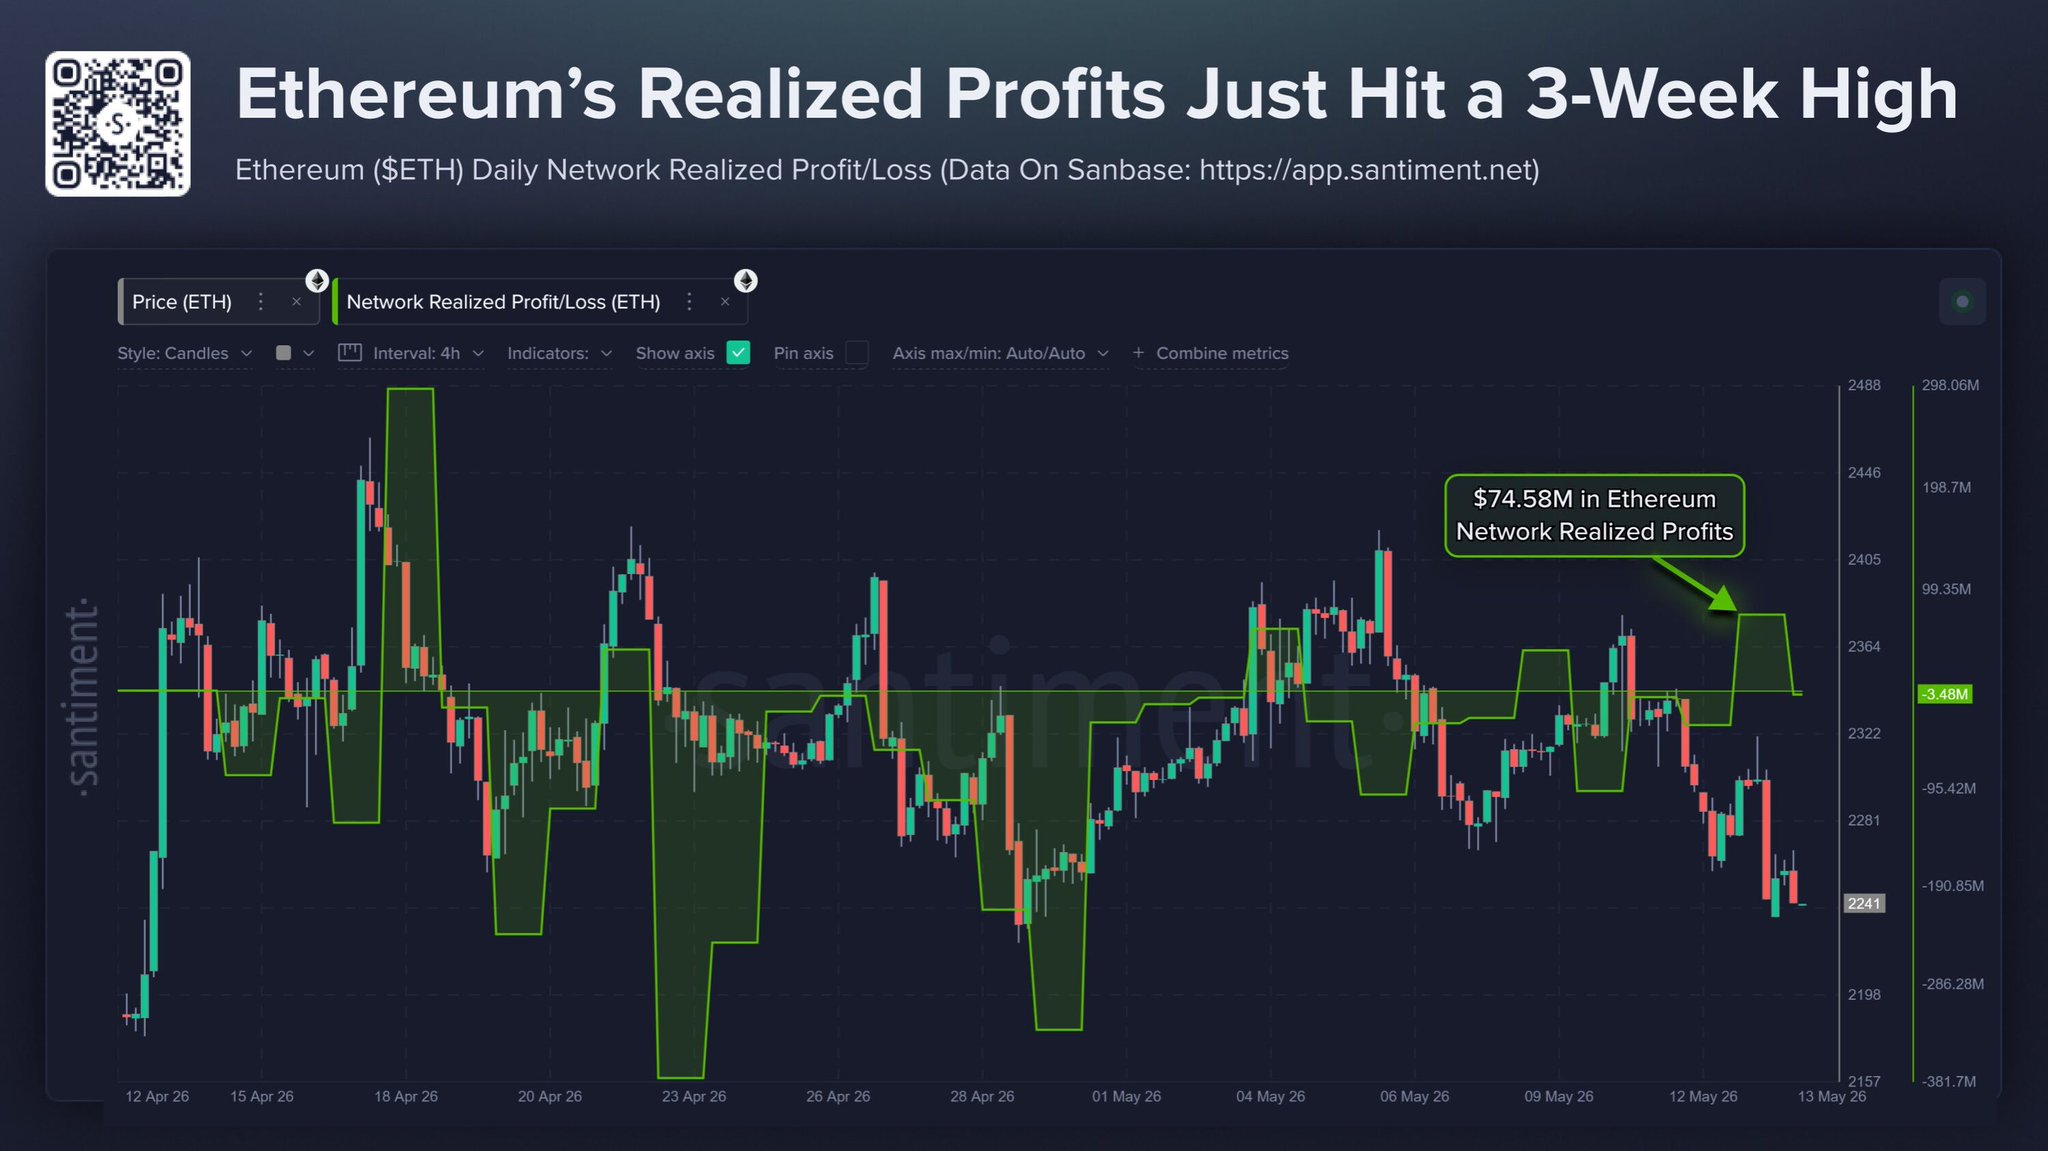
Each time an ETH wallet moves coins, Santiment calculates whether that move generates a profit or a loss compared to the original purchase price. The green curve shows the daily net balance of all these on-chain movements.
When you see high profits during a price drop, it's often a sign that holders who bought lower, probably between $1,750 and $2,000 in February-March, are deciding to take their profits. It's a natural market dynamic, and it shows that some investors are happy with their earnings.
In short, the market is showing a bearish short-term signal, but nothing too bad. Rather, we are talking about rotation, not capitulation. 🐻
Network Realized Profit/Loss — ETH
Chaque fois qu’un wallet ETH déplace des coins, Santiment calcule si ce mouvement génère un profit ou une perte par rapport au prix d’achat original. La courbe verte montre le solde net journalier de tous ces mouvements on-chain.
Quand on voit des profits réalisés élevés pendant une baisse de prix, c’est souvent le signe que les holders qui avaient acheté plus bas, probablement entre $1,750 et $2,000 en février-mars, décident de prendre leurs bénéfices. C’est une dynamique naturelle du marché, et ça montre bien que certains investisseurs sont satisfaits de leurs gains.
En bref, le marché affiche un signal court terme baissier, mais rien de bien méchant. On parle plutôt de rotation, pas de capitulation. 🐻