Hi everyone.
I recently implemented a GARCH(1, 1) in my research lab for estimating volatility. The idea behind it was not only to catch volatility clustering or have a more realistic volatility, but I also wanted to use this estimated volatility to build other features with it, such as z-scores, and compare it to a simple rolling standard deviation.
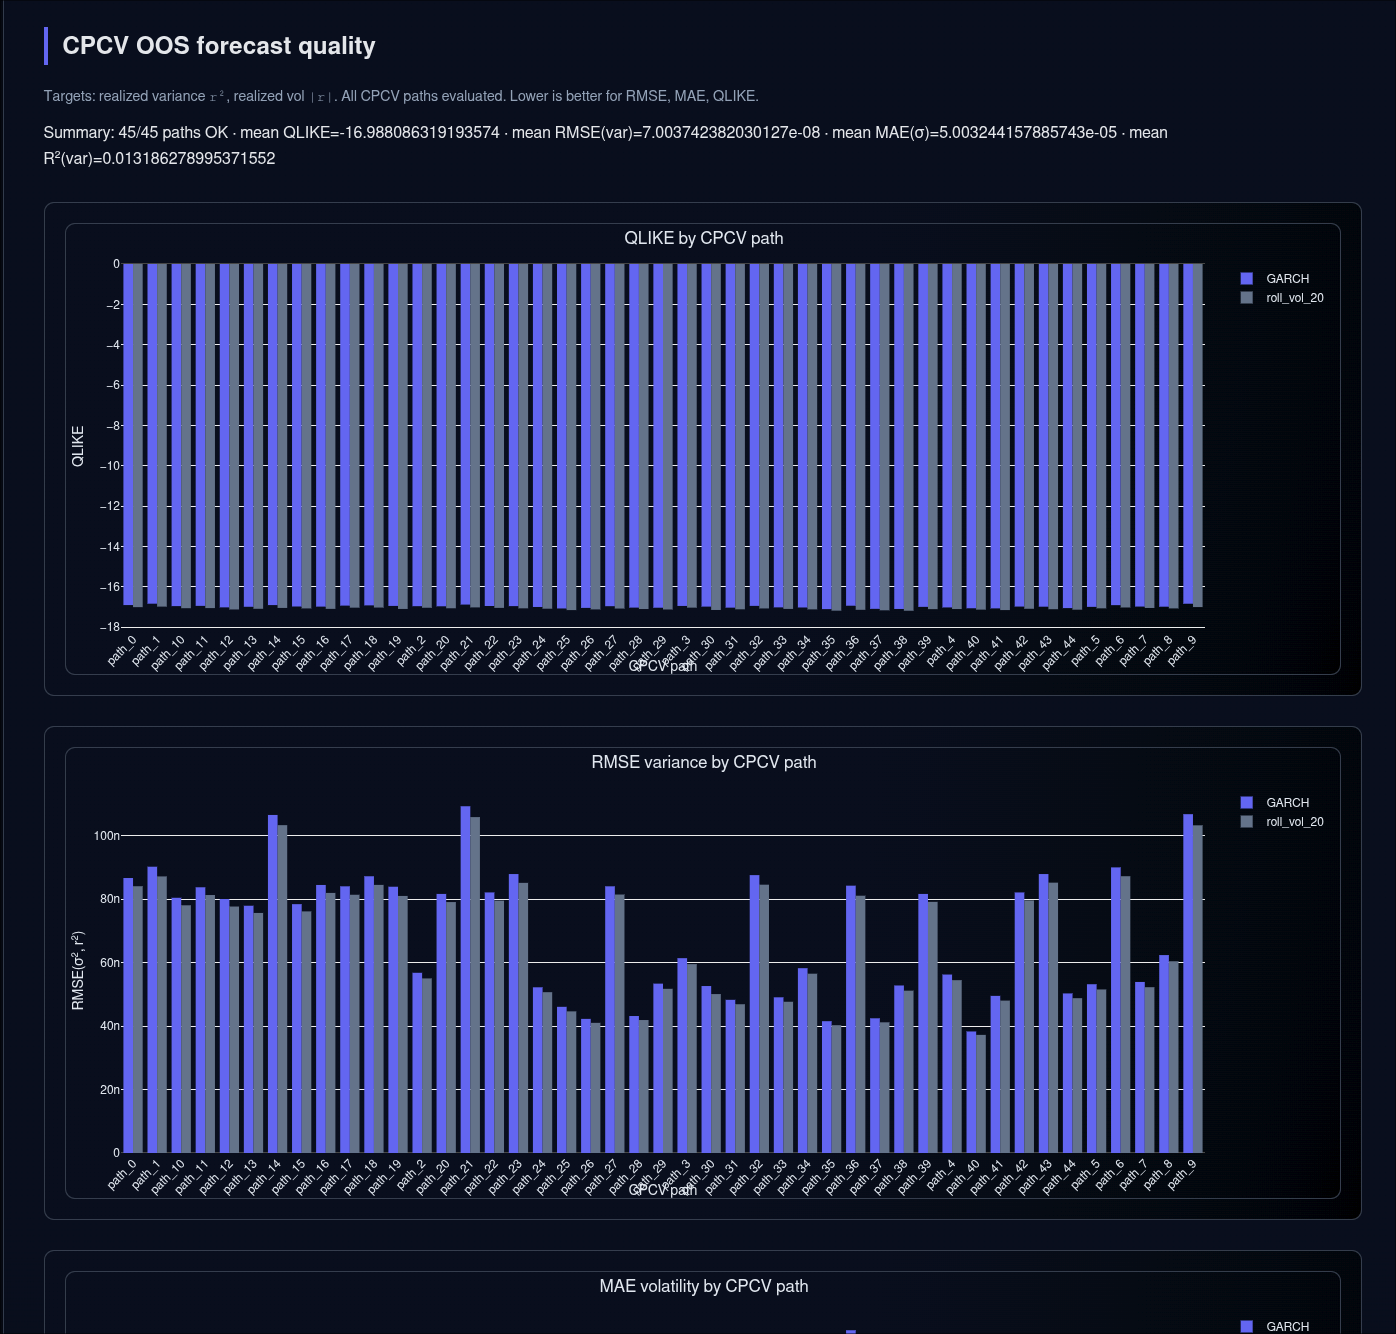
Here's an extract from my report. As you can see, the result seems to not really improve, but this is not surprising for multiple reasons. First, our bars here are intraday FX bars, not daily bars. Second, and probably the most important reason, I use information-based bars, which completely change the nature of my bars, and a big part of the noise is filtered.
One thing I can easily see with this type of bars is that there is not one distribution centered on 0, but two distributions centered on +10 bps and -10 bps (1 pip). Maybe a HMM could be interesting if there is a Markovian relationship between these two distributions.
I am planning next to build some relevant events in order to use event-based sampling to improve the accuracy of my ML models. I will try the so-called CUSUM filter (which looks naive imho but useful for the benchmark) and pullback and breakout events with different methods to define these events.
Thanks for reading me. Let me know if you want me to try some other events.