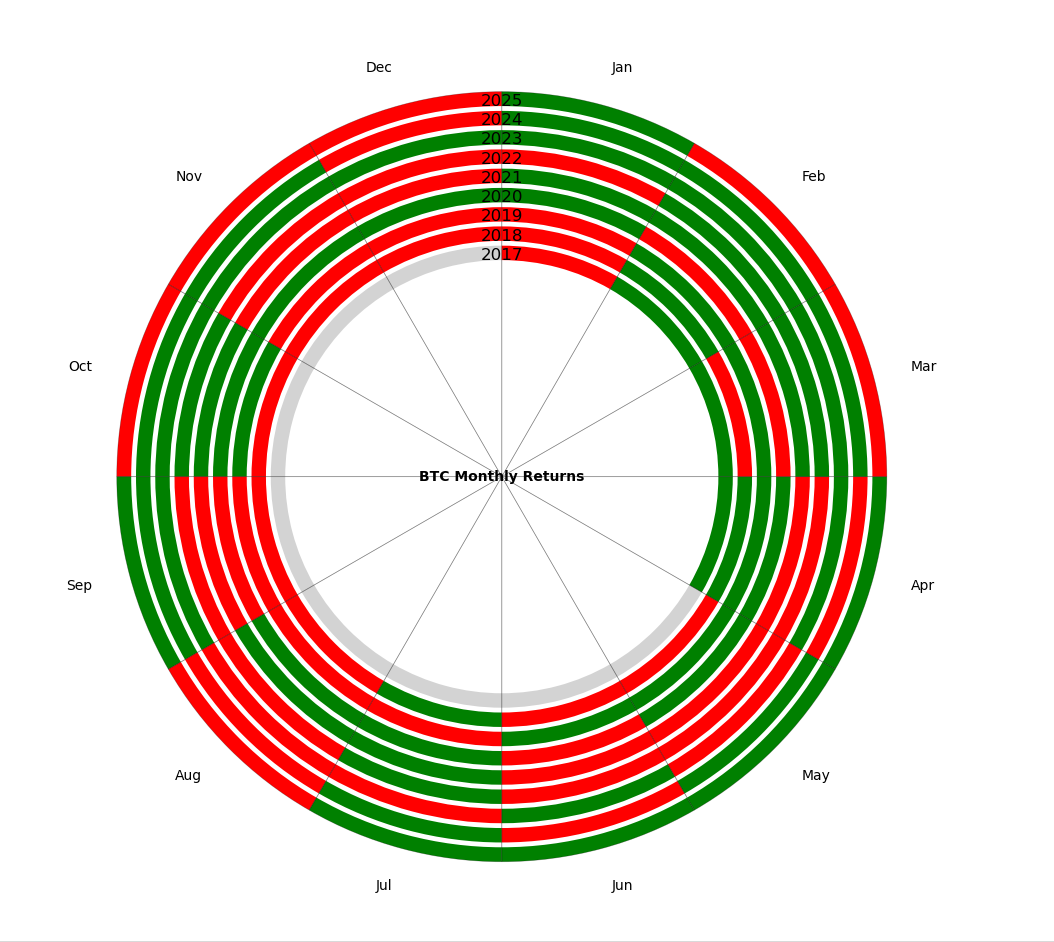
Back

Two months ago, i was inspired to plot data on an archimedean spiral.
Thanks to Quant apython course i was able to simulate that vision in a circle diagram.
Main benefit: It overlaps time making cyclical patterns more visible.
I computed Btc monthly positive/negative returns, had hard time getting percentage/change to plot inside the shapes maybe someone better with python could suggest a solution, help is greatly appreciated.
Post image
Code 13 lines
Dec 29, 2025 · 07:42 AM · 24 views
2 Reposts
8 Likes
7 Replies
@quantguild
Roman Paolucci Mod Trader FOUNDER
@quantguild · Dec 29, 2025 · 01:04 PM
Trader FOUNDER
This is very cool! FYI - you can’t upload .py files, you have to copy and paste code snippets, please try editing your post and pasting the Python code in!
Reply
@mrhodler9000 · Dec 29, 2025 · 10:32 AM
Good stuff! Try plotting the price in polar coordinates, ie radius = price, theta = time in a 4 year cycle. You will get a nice looking spiral with the peaks and troughs aligning in the same sectors. BTC is really something special.
Reply
@davchal · Jan 02, 2026 · 01:46 AM
Good stuff. Would like to see this representation beyond BTC. I'd encourage you to try various asset classes, indexes, and financial instruments to see where market capital is flowing. There's always a bull market going on somewhere.
Reply